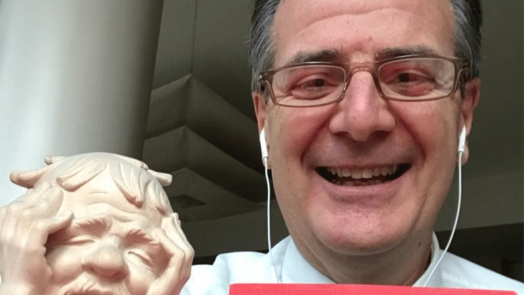
Oscar Farinetti: Italy is the unhappiest and most disharten country in the world
During a recent interview for the launch of his new book “E’ nata prima la gallina…forse” that includes 52 stories of optimist and successfull people, Oscar Farinetti when answered the question ” What is Italy’s percentage of optimism?”, replies: “Zero. We are the saddest and most dishearten people in the world, as a recent survey shows. In third place, out of 130 states, is Bangladesh, a country that has a slightly emptier belly, like we had in the post-war period. We are ‘entangled and enmeshed’.”
It looks like that the famous UniEuro owner’ slogan “Optimism is the spice of life” doesn’t apply to most of the Farinetti co citizens.
I wasn’t able to find the ranking mentioned by Farinetti but I went through some recent reports to understand better to what extend the Farinetti’s negative comment is confirmed by other sources at give a slightly better picture of Italy even though there is still a lot to do to improve well being and happiness in the country.
Italy Happiness ranking
The World Happiness report 2023 rank Italy in the 33rd place for the Average 2020-2022 Happiness Index with a rating of 6.4, 1 point lower than the average of the top 10 countries. If we compare the performance of Italy in the last 10 years, the improvement is ranked only in the 61st position but it is still positive while almost 50% of the countries in the period worsende their ranking. So according to this measure the situation of Italy is not so negative and alll in all Italy is not ranked so dramatically bad as the Farinetti’s quote refers.
It is worth looking at the eight components of Italy Ranking and the structure of the Happiness index:
- GDP per capita Italy is ranking at position 27 with a $ per capita of 41,5K while the top 10 are at an average of 70K.
- In Social support Italy ranks at position 46 with an index of 0.88 versus the leading group od 0.95
- In Life expectancy Italy is ranked in the 11th position at par with Sweden number 10 with a value of 71,9 and with 1 year of difference versus the average of the top ten
- In Freedom to make Life Choices Italy ranks 108 on a total of 136 countries analyzed.
- In Generosity Italy ranks 62 in the middle of the ranking but with an index of 0.3 that is half the one of the top 10
- In perception of corruption Italy, that is an inverted index, the highest the worst, Italy ranks in the 40th position at 0.85 versus the worst at 0.9
- In Positive affect Italy ranks at 91st position at 0,624 while the top is around 0,8
- In negative affect Italy is in the 57 position
- (see the end of the article for explanatory notes)
Then if we exclude life expectancy and income pro capite, Farinetti comment does’t seem so wrong: italians feel blocked in their country, where they can not choose what to do in life. High unemployment, barrier to women work, dramatic working conditions available to young generation, blocked labour market do not offer many opportunies, so the ranking is extremely low.
High perception of corruption, with mid generosity and social support reinforce the image of a country quite selfish, not transparent where things are blocked unless you know the “right person”.
What is also fully in line with Farinetti’s negative comment is positive affect: italians ranked 91/136 when asked if they laughed, enjoyed or had interests the day before the survey. Combining all the findings the situation is not good.
Italy low also in The Social Optimistic EU Ranking
I kept digging deeper on the topic, looking at the Dec 2022 Censis report that confirms itlians as “sad and disharten’ : ‘
Melancholy, frightened by global events that could compromise the present and the future at any moment, less and less willing to follow the sirens of influencers and luxury but rather outraged by the display of money and the economic inequalities flaunted in life and on social media.
It is the portrait of Italians that emerges from the 56th Censis Report, the one that photographs a country that has “entered the cycle of post-populism”. In the background the European primacy of NEETs, increasingly empty classrooms due to demographic contraction and the health system which will have to face a shortage of personnel. The report comes after a dramatic sequence of global events: Covid, the war in Ukraine, rising inflation and the energy crisis. A deadly poker that adds up to pre-existing vulnerabilities and which determines in Italians “a renewed demand for certain prospects of well-being” but also “instances of equity that can no longer be liquidated as unrealistic expectations fomented by some demagogic political leader”.
The Social Optimistic ranking found that Ireland and Denmark are the most socially optimistic countries in the EU, according to Eurofound’s Social Optimism Index, a newly developed composite indicator which measures six variables of optimism among people in Europe. The index was applied to measure social optimism of citizens in the EU prior to the outbreak of the COVID-19 pandemic. Additional research from Eurofound has confirmed that Ireland and Denmark remained the most optimistic countries even after the coronavirus pandemic took hold in Europe. Italy ranked very low, fourth to the bottom, with a percentage of pessimist citizen that, by far overcome optimist
Very recent Benessere Equo Sostenibile BES Report confirms the picture
The Bes Report is an in-depth portrait of the state of the country, carefully portrayed by
official statistics from the perspective of the well-being of its citizens.
Well-being is, or should be, the ultimate goal of policies.
A challenging, sometimes arduous goal, especially when circumstances are adverse: a devastating pandemic, an environmental crisis, threats to peace in Europe.
Created in continuity with the experiences of the influential Stiglitz-Sen-Fitoussi Commission of 2009, Eurostat’s Beyond GDP programme and the OECD’s Better Life Index, as a
widely-participated project, the BES, with its indicators on Italy which have now reached
the considerable figure of 153, represents a fine and comprehensive tool for measuring the
degree to which policies actually produce changes in people’s lives.
The data are organised in the major domains of health, education and training, labour,
economic well-being, social relations, politics and institutions, safety, subjective well-being, landscape and cultural heritage, environment, innovation, research and creativity, and
quality of services.
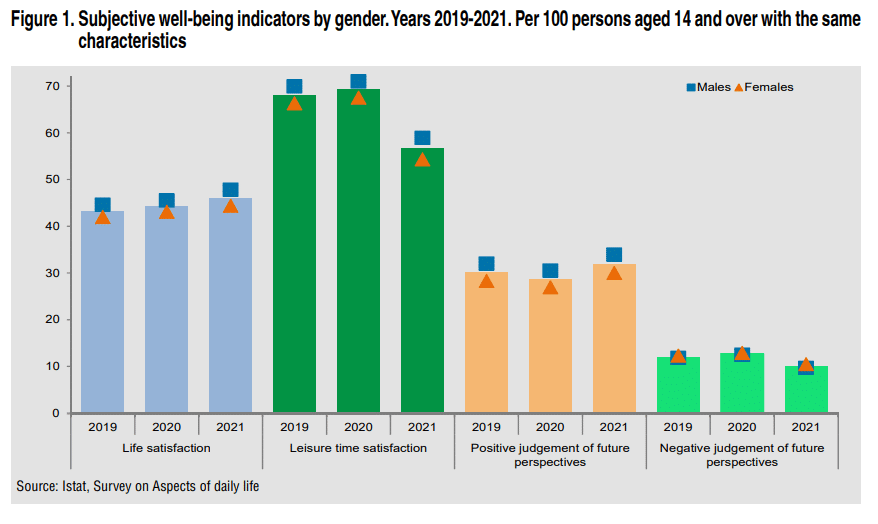
ISTAT researchers comment that “It took nine years to recover from the collapse in subjective well-being that occurred in 2012.The percentage of population very satisfied with their lives reached 46% again in
2021 and it was precisely the two pandemic years that ensured this achievement. The increase in subjective well-being in the pandemic years is consistent with findings in other countries. People are satisfied with their lives not only by taking into account what happens to themselves, but by relating it to the context, and in this case to the drama of the events related to the spread of COVID-19. The growth in subjective well-being occurred despite the sharp decline, which had never been seen since the beginning of the historical series, in leisure time satisfaction, which lost 12.6 percentage points in 2021.
If we analyze more specifically the opinion on future perspectives, the researchers say that “2021 saw the highest proportion of optimists and the lowest proportion of pessimists.The percentage of people who believed that their personal situation would improve over the next five years rose to 31.9% in 2021, reaching the highest value observed so far. This
growth followed the 1.4 percentage point drop that had brought the share below 30%
(28.7%) in 2020, due to the many uncertainties that accompanied the first year of the
pandemic. The attitude of growing optimism towards the future, probably also as a result
of the start of vaccination campaign, was also confirmed by the decrease in the percentage
of people who believed that their situation would worsen (down to 10.2% from 12.7% in
2020 – Figure 1).
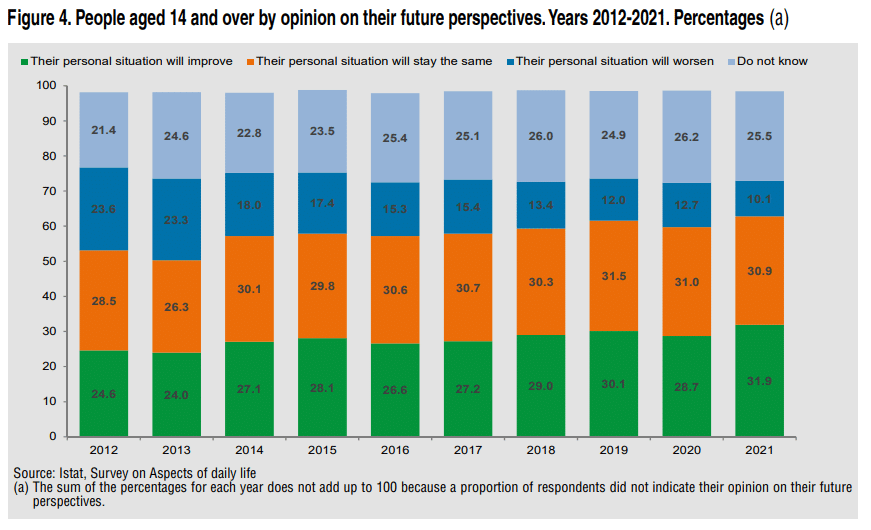
If we broaden our view over a longer period, between 2012 and 2021, the assessment of future prospects shows an increase in the percentage of optimists in all age groups, although
starting from very different values (Figure 4). The progressive reduction of those who state
that their situation will worsen in the next five years is even more evident. The lowest value can be observed in 2021, when it was 13.4 percentage points lower than in 2012. The
percentage of people who believe that the situation will remain the same is stable at around
30% over the past few years. Finally, a share of more than a quarter of the population, virtually unchanged since 2016, states that they do not know how to assess this
What we can do ? Let it go or propose alternatives?
Here are five witty and humoristic actions that Italy could consider to improve the situation:
- “Dolce Vita Mondays”: Declare one day of the week as a national holiday dedicated to enjoying the sweet pleasures of life. Italians can take a break from their worries and indulge in their favorite Italian foods, music, and activities.
- “Laughter Therapy”: Organize nationwide laughter yoga sessions, where people gather in public spaces and engage in laughter exercises to boost their mood and spread positivity.
- “The Pasta Dance Challenge”: Create a viral dance challenge where people incorporate pasta-themed moves into their dance routines. It would be a fun and lighthearted way to celebrate Italy’s culinary heritage and bring a smile to people’s faces.
- “Compliment Day”: Designate a day where Italians are encouraged to give each other genuine compliments and express appreciation for one another. It would be a delightful way to spread positivity and uplift spirits.
- “Joyful Art Installations”: Commission artists to create whimsical and playful art installations in public spaces across Italy. These installations could feature colorful and interactive elements that encourage people to engage, smile, and experience a sense of joy.
Remember, these suggestions are meant to be lighthearted and fun. While humor and wit can provide moments of levity, addressing deeper social and cultural challenges may require more comprehensive efforts.
Notes
- ————————————————————————————————————-
- Below the definition of each measure
- GDP per capita is in terms of Purchasing Power Parity (PPP) adjusted to constant 2017 international dollars, taken from the World Development Indicators (WDI) by the World Bank (version 17, metadata last updated on January 22, 2023). (…) The equation uses the natural log of GDP per capita, as this form fits the data significantly better than GDP per capita.
- The time series for healthy life expectancy at birth are constructed based on data from the World Health Organization (WHO) Global Health Observatory data repository, with data available for 2005, 2010, 2015, 2016, and 2019.
- Social support is the national average of the binary responses (0=no, 1=yes) to the Gallup World Poll (GWP) question “If you were in trouble, do you have relatives or friends you can count on to help you whenever you need them, or not?”
- Freedom to make life choices is the national average of binary responses to the GWP question “Are you satisfied or dissatisfied with your freedom to choose what you do with your life?”
- Generosity is the residual of regressing the national average of GWP responses to the donation question “Have you donated money to a charity in the past month?” on log GDP per capita.
- Perceptions of corruption are the average of binary answers to two GWP questions: “Is corruption widespread throughout the government or not?” and “Is corruption widespread within businesses or not?” Where data for government corruption are missing, the perception of business corruption is used as the overall corruption-perception measure.
- Positive affect is defined as the average of previous-day affect measures for laughter, enjoyment, and interest. The inclusion of interest (first added for World Happiness Report 2022), gives us three components in each of positive and negative affect, and slightly improves the equation fit in column 4. The general form for the affect questions is: Did you experience the following feelings during a lot of the day yesterday?
- Negative affect is defined as the average of previous-day affect measures for worry, sadness, and anger.
- —————————————————————————————————————